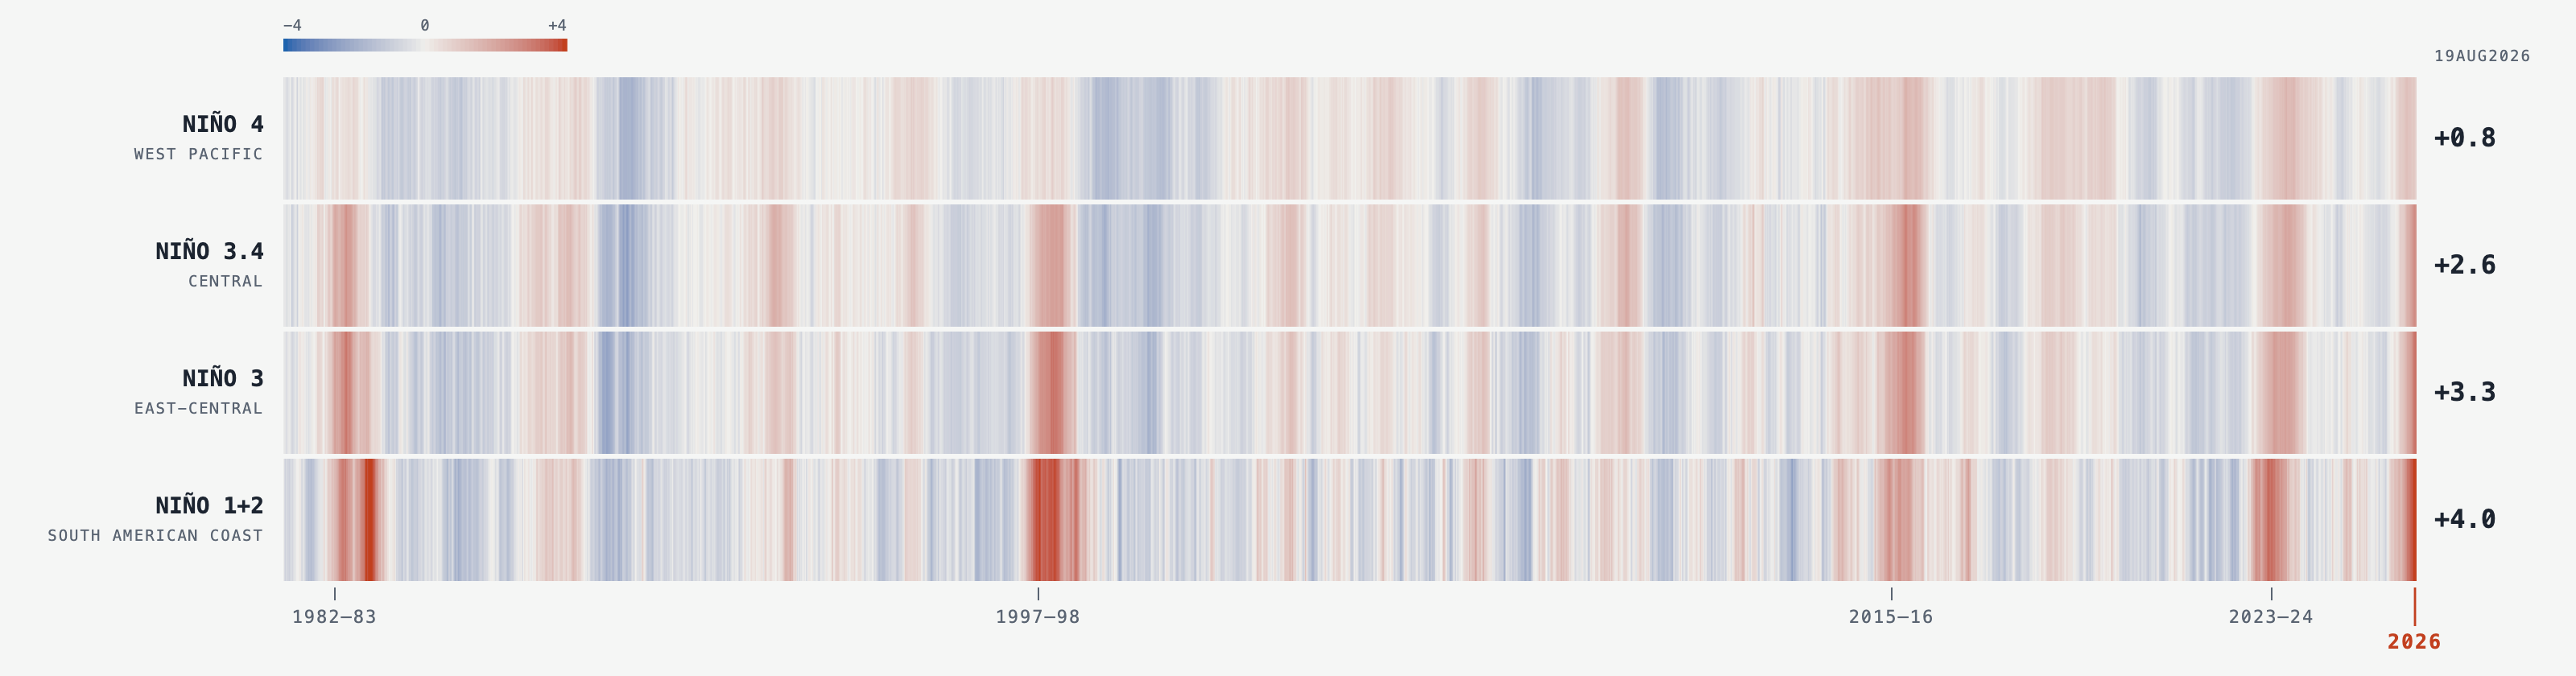
A record El Niño is forecast to peak this winter — and unlike almost any other disaster, it published its itinerary months in advance. This project follows it through the world's food system in real time: the harvest already failing in eastern Australia in October, the crop planted into the warning in southern Malawi in November, and the same households at harvest in May.
Almost every documentary project on climate and hunger is made afterwards, because that is when the story gets commissioned. This one starts before. The November planting frames exist only because the forecast exists now, and they can only be made in a window of about three weeks. Returning to the same households in May 2027 closes the argument.
This post is the front door. If you just landed here, it holds the whole project: what it is, who is making it, what the forecast actually says, where the money stands, and what you get if you follow along. It gets updated as the project moves, so it is the post to send people.
Follow this project. The dispatches track the forecast, the funding and the field from here to the May 2027 harvest — free, from this site.
The event, measured
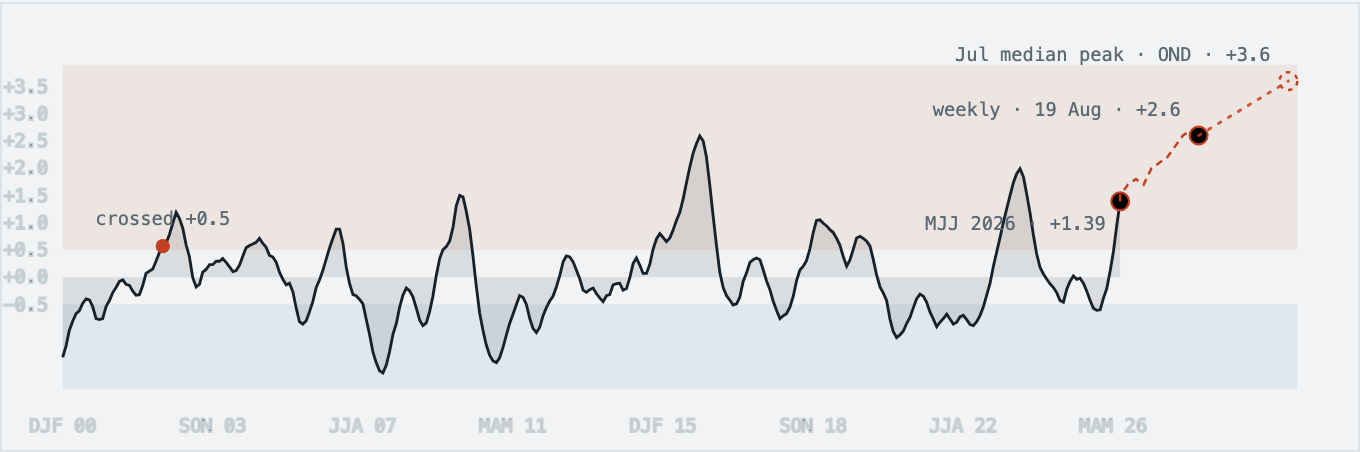
The engine of all of it is a band of the tropical Pacific running hot. NOAA's operational index reached +1.39 °C in its MJJ 2026 season; the latest weekly reading stands at +2.6 °C, an El Niño Advisory is in effect, and the agency puts the chance of a very strong event above 90%. The July multi-model median put the coming peak at +3.6 °C — beyond anything in a century and a half of observation. The mid-August plume holds that picture and adds timing: the peak lands in October–December 2026, with 25 of 26 models calling the event very strong. No seasonal system has ever been graded on an event that size, so this project treats these numbers as a forecast, never a certainty.
The same warm water lands differently everywhere it touches. The project tracks 37 sites in nine regional windows; the two legs of this arc are where evidence, access and timing align:
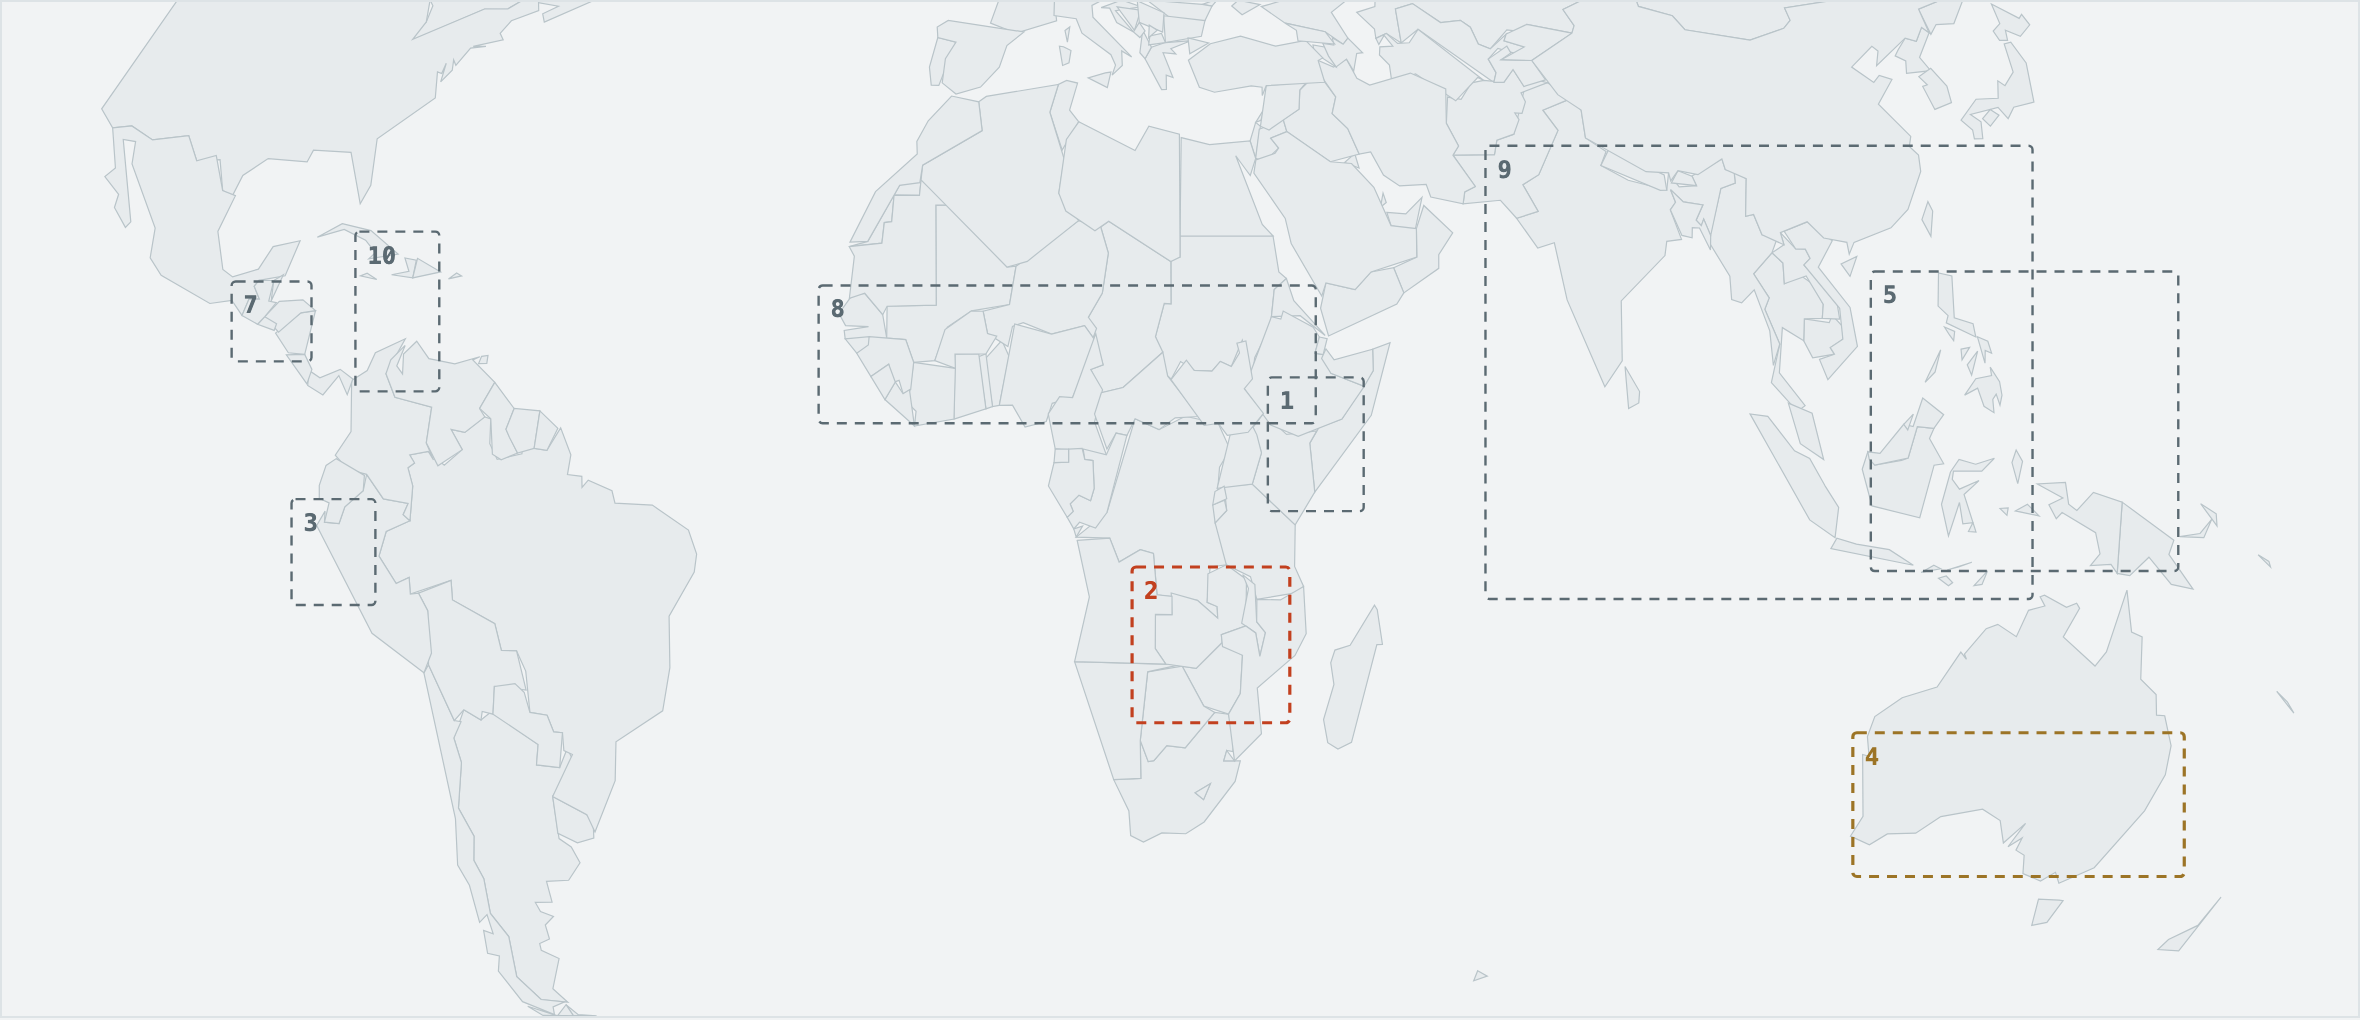
Leg one — Australia, 13–24 October: the first failed harvest
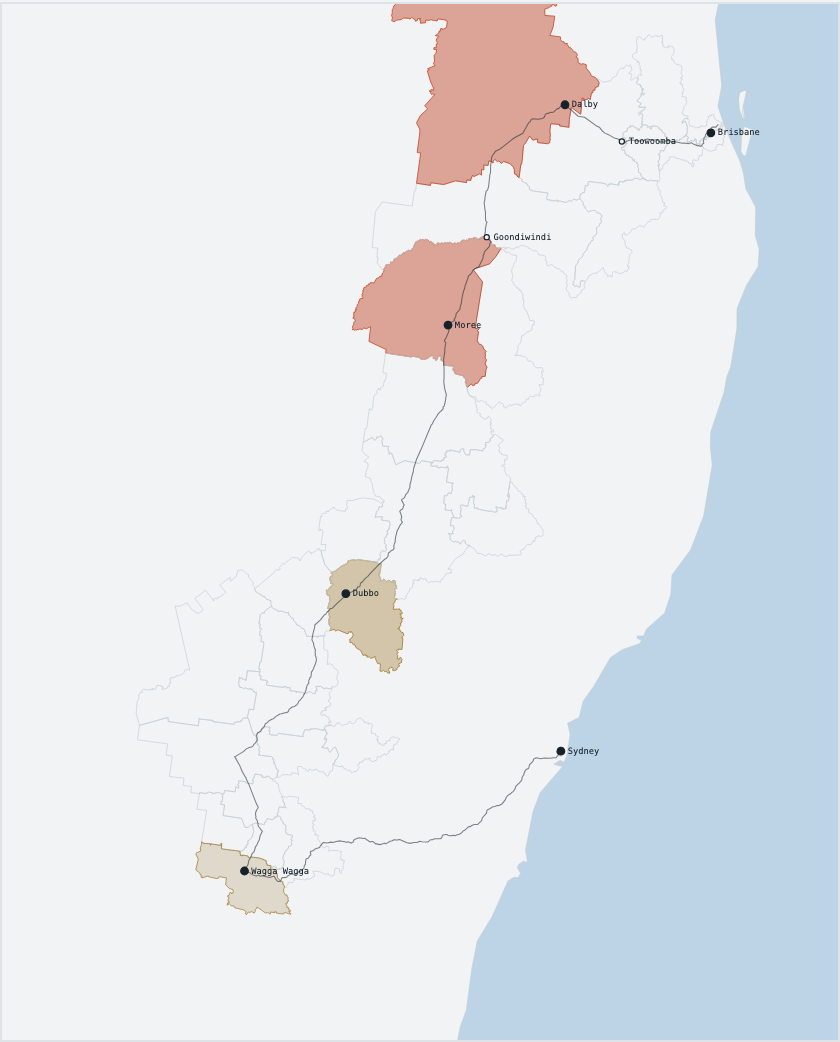
Australia's grain belt is where an El Niño shows up first and in public, in export figures the whole world reads. The failure this year is northern — Queensland's Darling Downs and northern New South Wales — not the Riverina where the story is usually filed from.
Out of 50 runs of the seasonal forecast, this is how many see each district’s growing season coming in below normal:
| Dalby | Qld, Darling Downs | 43/50 | |
|---|---|---|---|
| Moree | north-west NSW | 43/50 | |
| Dubbo | central-west NSW | 36/50 | |
| Wagga Wagga | Riverina | 33/50 |
That north–south gradient is the story, and it is why this route runs Brisbane → Downs → Moree → Dubbo → Wagga → Sydney — into the districts the forecast actually names.
Leg two — Malawi, 12–25 November: planting into the warning
In July, Malawi's own meteorological service named twelve southern districts facing dry spells, severe drought and severe flooding at once, and told them to plan for all three together. Two and a half million Malawians — 14% of the country — are already in Crisis for exactly the months the next crop goes in. The largest donor cut its assistance 59% a year before the strongest El Niño ever forecast.
This is not a project about drought. It is about what a society does with a year of warning.
The route goes where the institutions have already pointed. Three bases, no domestic flights, every district a day trip:
| Balaka | TIER 5 | CFGB district; modelled onset 14 Nov lands mid-trip |
|---|---|---|
| Chikwawa | TIER 5 | Lower Shire; Illovo sugar estate irrigates from the same river |
| Thyolo | TIER 5 | tea estates: wage labour beside smallholders |
| Nsanje | TIER 5 | deep Lower Shire; no ATM, one road in |
| Machinga | TIER 4 | severe drought, low flood — the drought-only case |
| Zomba | TIER 4 | former capital; Kamuzu Barrage nearby |
| Mulanje | TIER 5 | tea, and a community mini-grid |
Tiers are the Department of Climate Change and Meteorological Services’ own district risk report, 15 July 2026. Tier 5 is its critical, compound-hazard category.
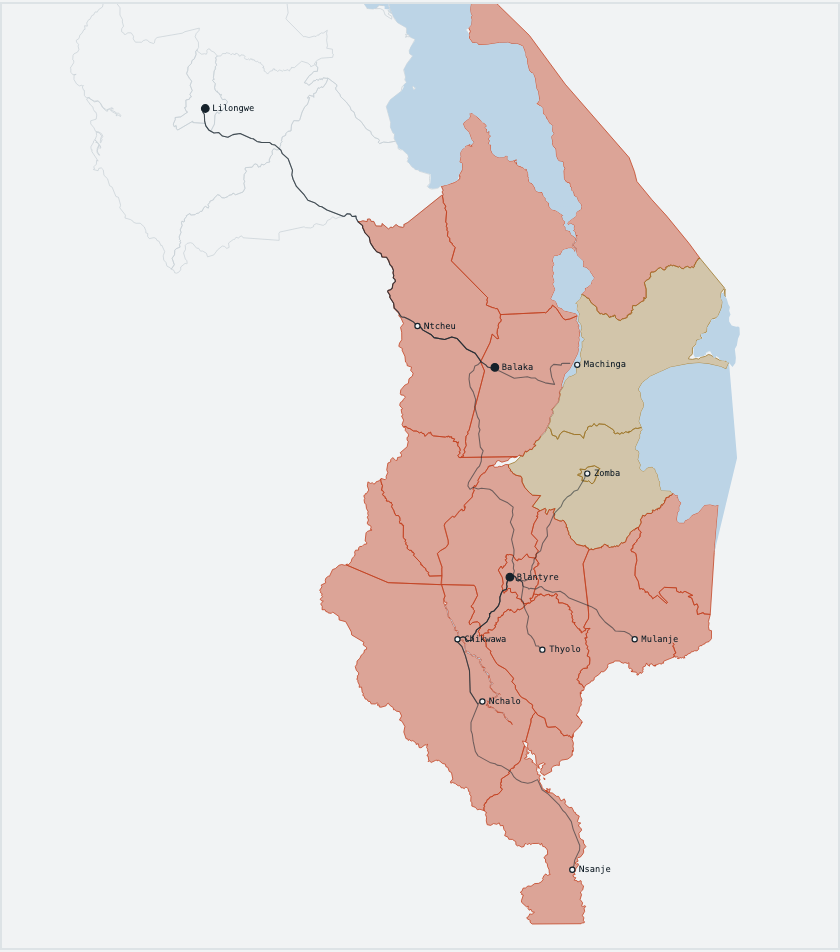
El Niño roughly doubles the odds of a failed season here; it does not condemn one. In November, at the sites this trip visits, the dry signal has not arrived yet — that is precisely the point. The photographs are of people committing seed and labour to a season nobody can yet call.
Why the two legs are one story
Australia is the exporter; Malawi is the importer of the consequences. One country's failed harvest is a line in a commodity report. The other's is a household deciding how much seed to keep back. Photographed six weeks apart, by one person, they are the same event at both ends. The formal device is the diptych: the same household, the same frame, at planting and at harvest — November's photograph is deliberately incomplete until May answers it.
Who's doing this
I'm Bryson Masse, a science and climate journalist in Toronto. I've been reporting for about a decade, on climate-driven flooding for WIRED among others, and this project is my return to the visual side of the beat: the camera doing the arguing, with the reporting discipline underneath it. That discipline is the point. Every number in this post went through the same checking my written work gets, and some early claims did not survive it. More on that below.
The frames, so far
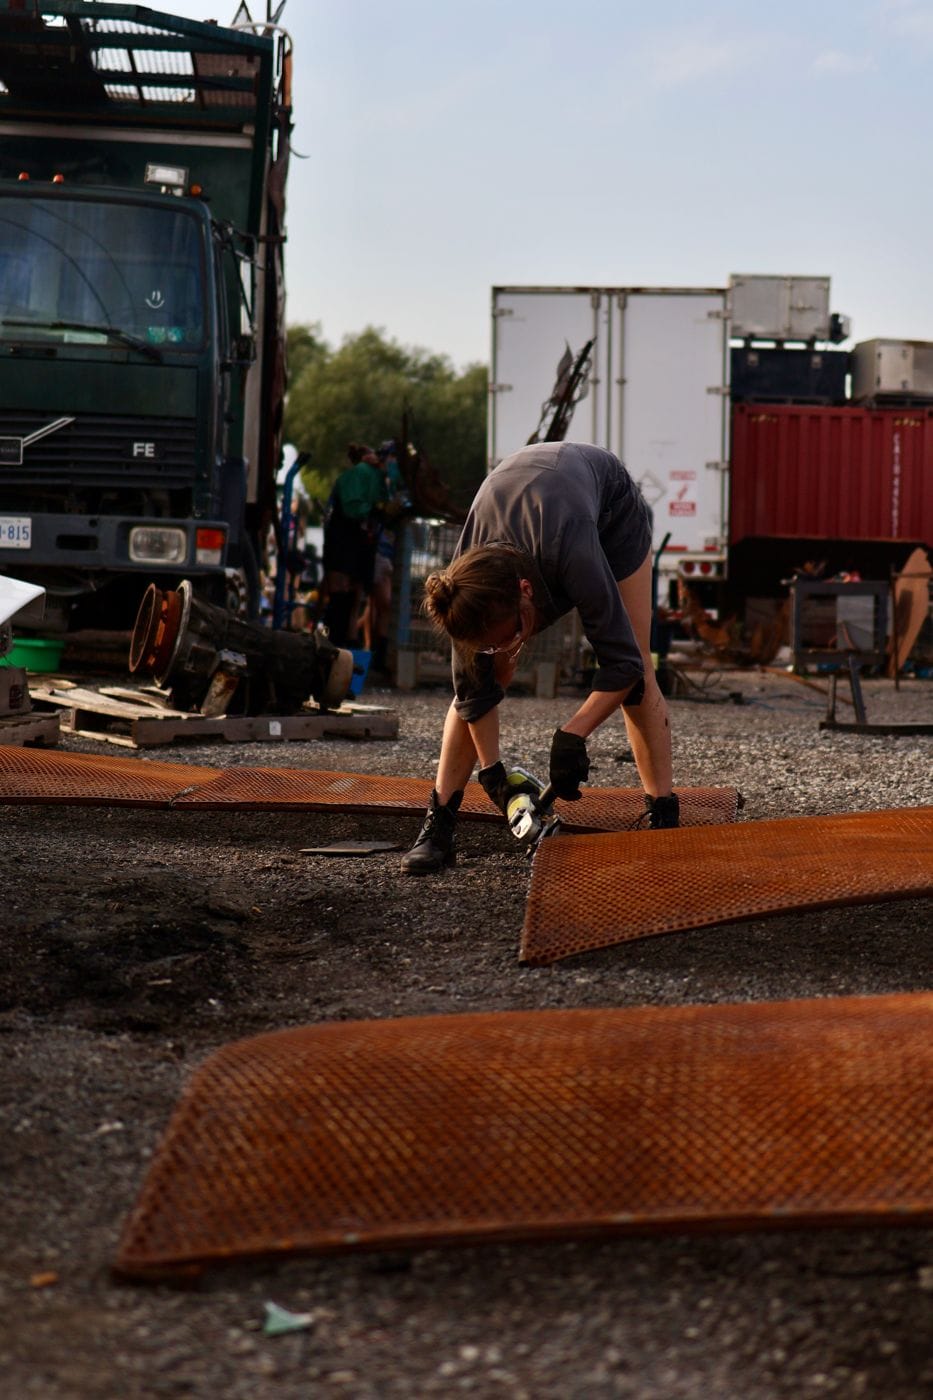
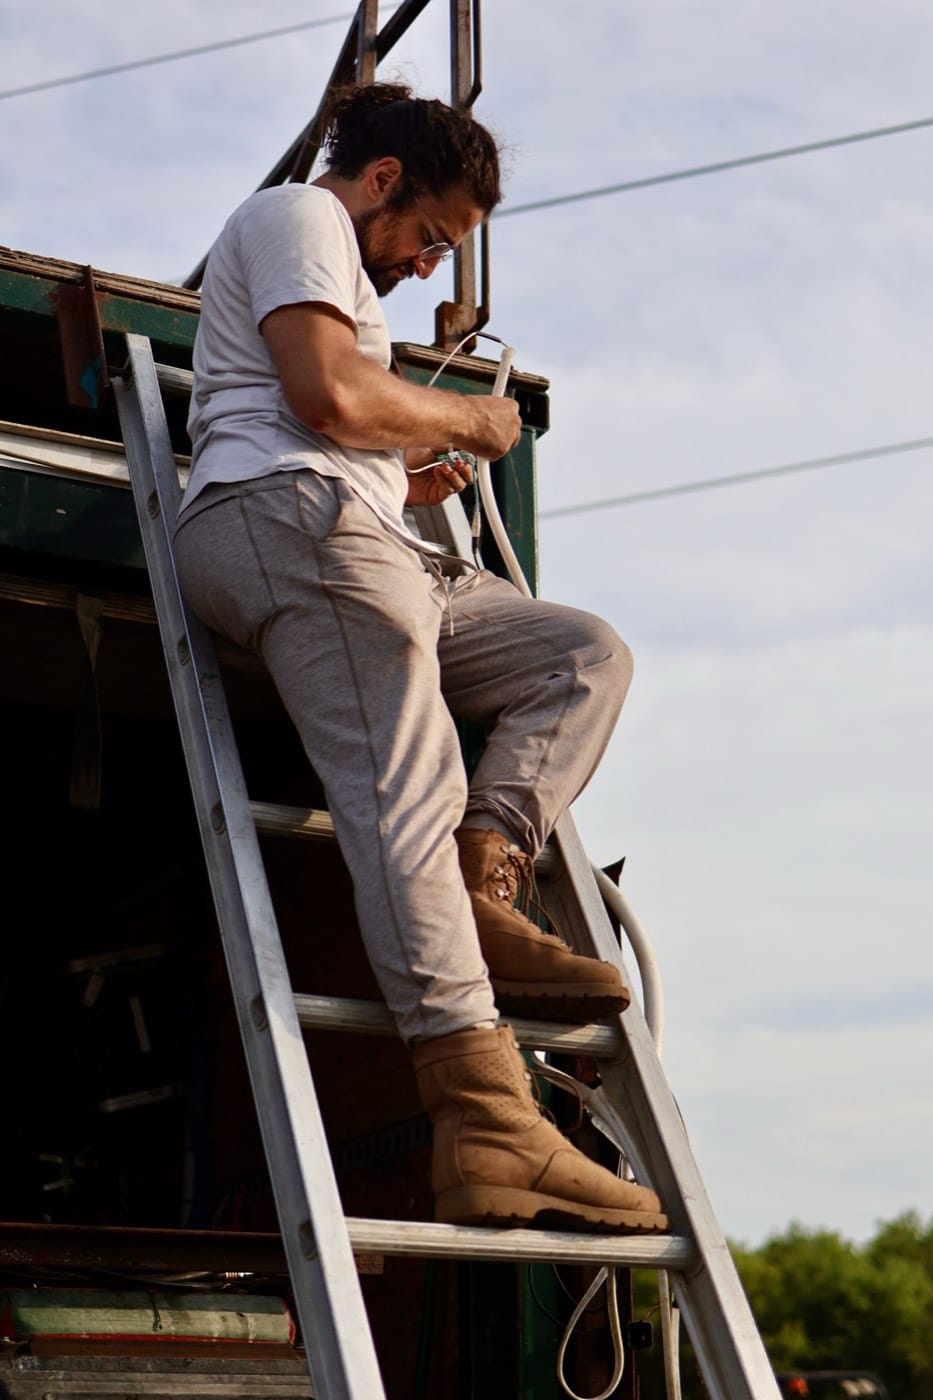
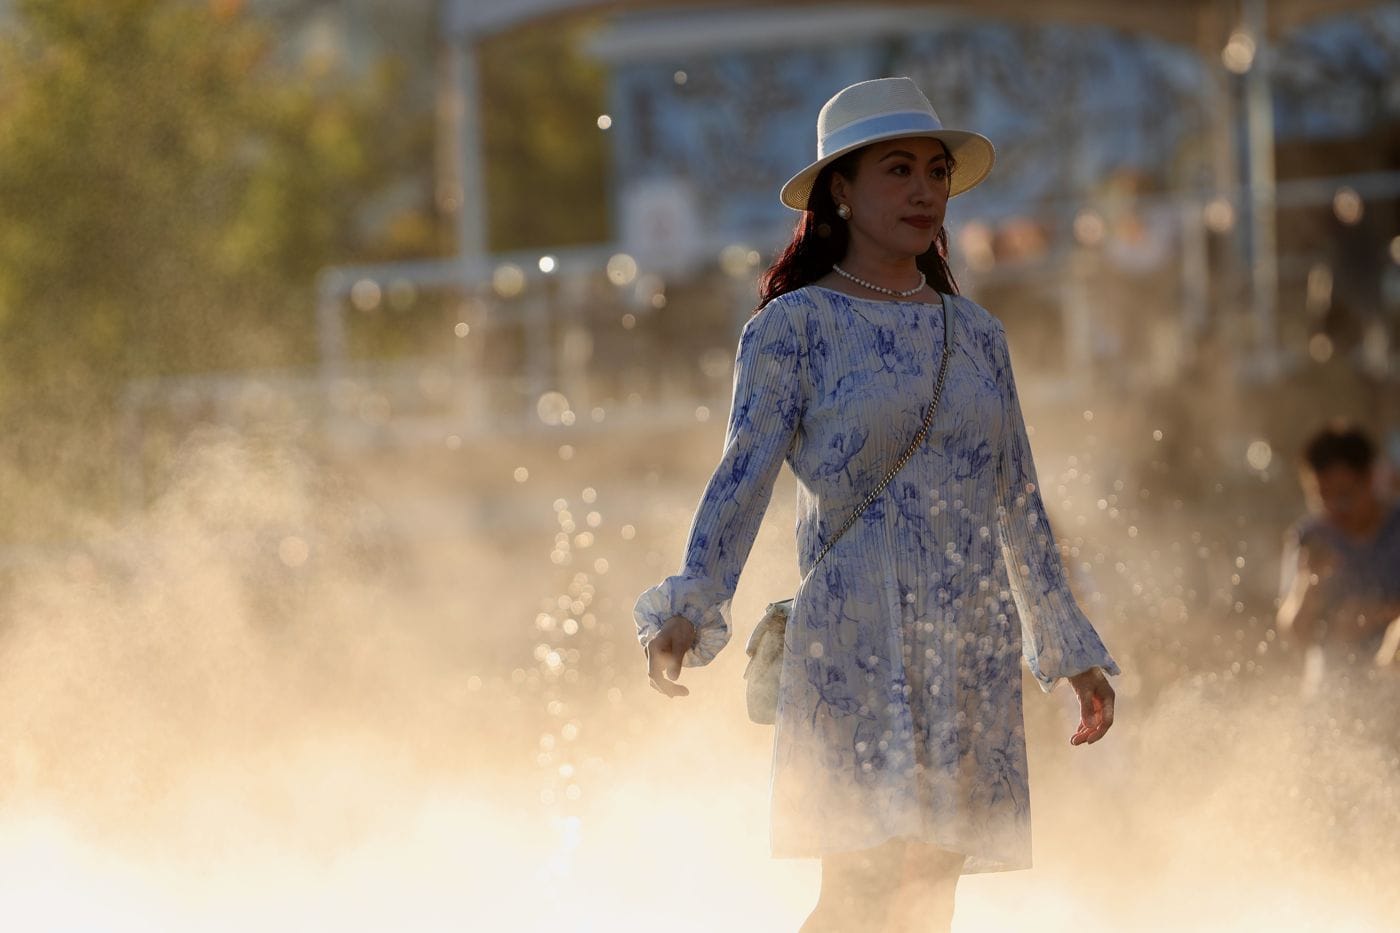
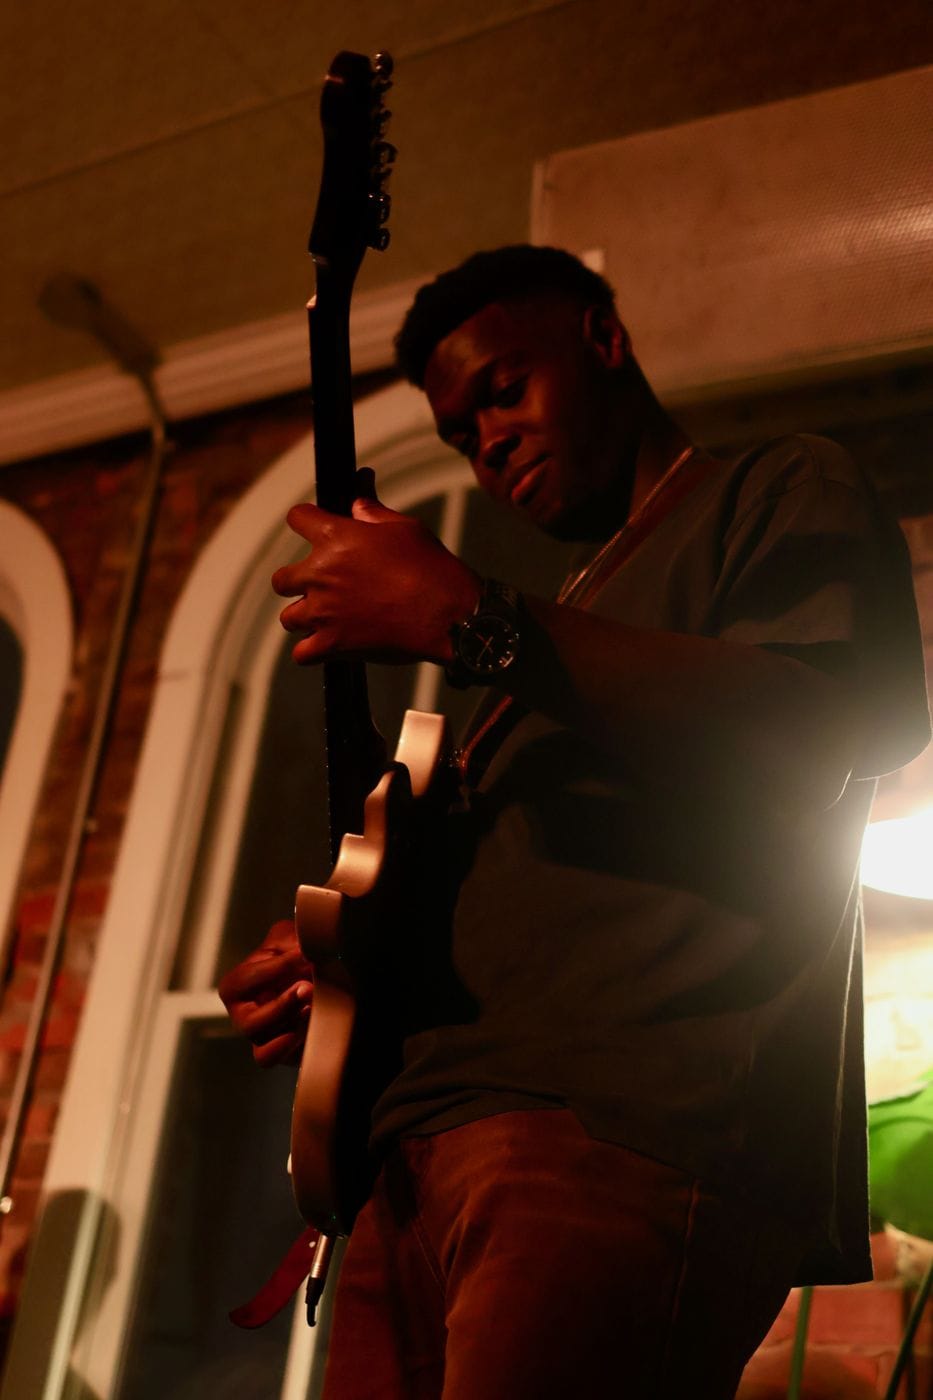
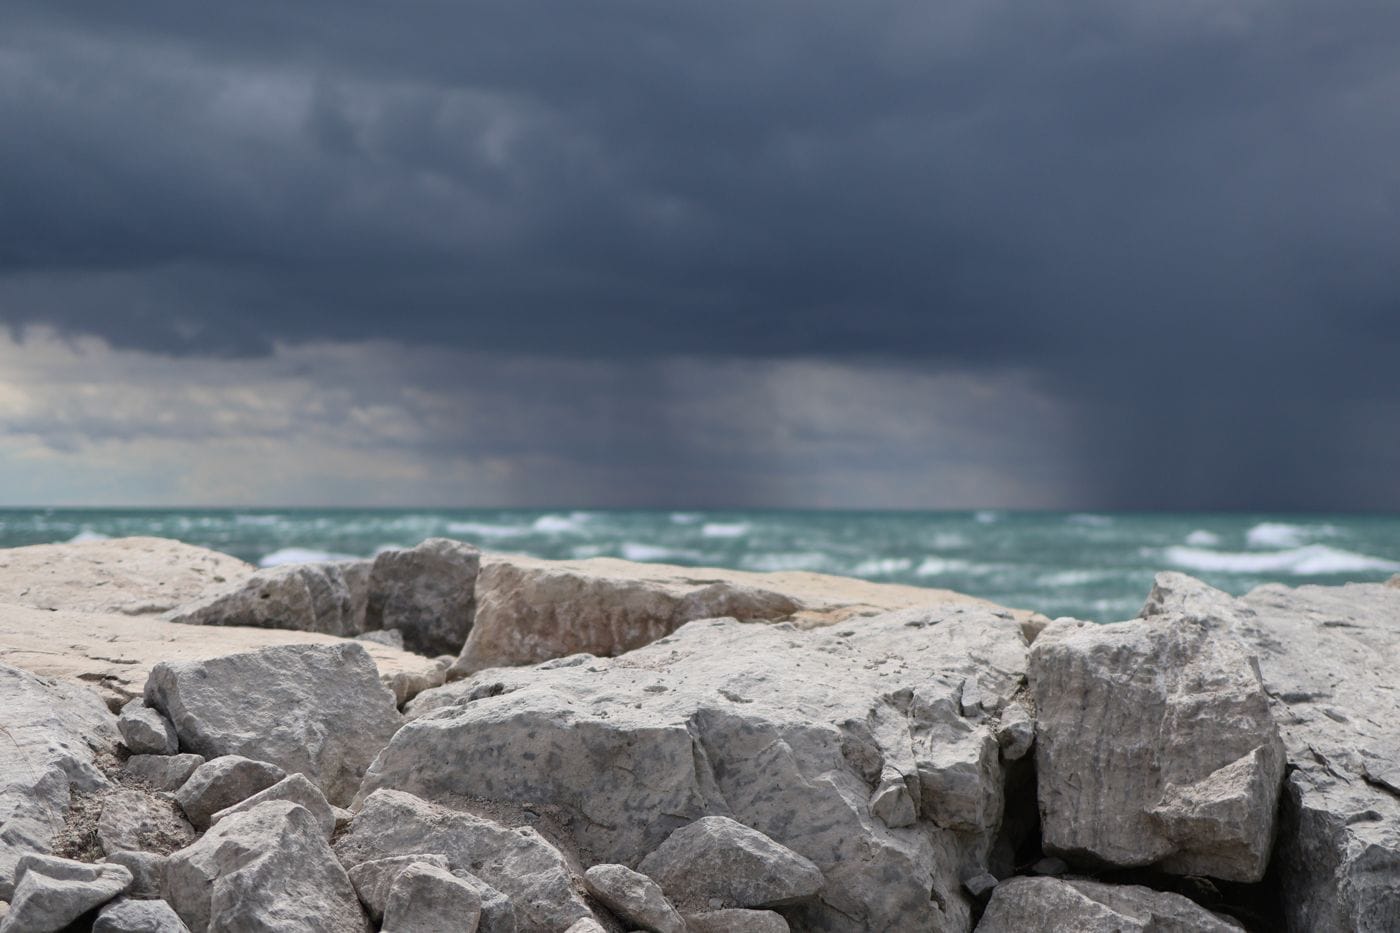
The argument above is data. The work is photographs. Five selects from current work — Toronto and Ontario, 2025–26 — chosen for what the field will ask of them:
How this project checks itself
Every figure in this post is generated from the project's data layer, not typed into the prose. The forecast numbers come from named institutions: NOAA's weekly ocean readings, Malawi's own meteorological department, FEWS NET, the IPC food-security system, the regional climate outlook forums. Each claim the project makes is tracked, and when one fails checking it gets withdrawn and recorded, and it never gets republished. The checks run on every page before it goes out. That has already retired some early figures, and it will retire more. A project built on a forecast owes you its error bars.
The calendar
| 1 Oct 2026 | Australia go/no-go, decided against written criteria |
|---|---|
| 13–24 Oct 2026 | Leg one: Brisbane to Sydney through the northern grain belt |
| 24 Oct 2026 | Malawi commit point; after this, deferring is itself a decision |
| 12–25 Nov 2026 | Leg two: planting season, southern Malawi |
| 30 Nov 2026 | Hard return to Toronto, no exceptions |
| May 2027 | The return: same households, same frames, at harvest |
Those dates are commitments. The planting photographs can only be made in one three-week window, so the whole project is built to hit it.
What you get if you follow
The dispatches are free and they carry the whole thing: the monthly forecast checkpoints as they land, the funding decisions made in the open, dispatches from the road in October and November, and the May return that answers the planting photographs. If the record El Niño arrives, you watched it coming. If it doesn't, you watched a forecast system meet the hardest test it has ever been given. Either way, you saw the checking.
Practicals
The whole arc — all three legs — is CAD 26,234–36,096, indicative ranges: Australia CAD 6,340–8,363, Malawi CAD 9,594–12,633, the May return CAD 10,300–15,100. It is deliberately fundable in pieces: each leg stands alone, and partial funding scales the route, never the method. Both legs run on written go/no-go criteria with dated decision points, and a hard return to Toronto by 30 November. The peak forecast is treated as a forecast, never a certainty — and either outcome files.
Back this project
Four lanes in, one per desk:
For commissioning editors
Commission one leg, or the pair. If budgets settle later, a letter of interest costs nothing now and unlocks accreditation and the reporting grants — it is the highest-leverage document an editor can issue this project.
Deliverable: Per leg: a 12–15 frame edited essay plus 1,500–2,500 words, selects filed same-day from the field where coverage allows. The May return closes the arc with the same households. First-publication window negotiable by leg.
Commission a legFor Canadian desks
A Canadian outlet's letter of interest is the specific unlock: the R. James Travers Fellowship (CAD 25k, deadline 12 Jan) requires one — and the fellowship then funds reporting your desk would otherwise pay for.
Deliverable: The arc with the Canadian frame: Canada's aid posture after the US withdrawal, and the Australia–China grain trade Canadian growers sit inside. Essay plus text per leg, same-day selects, by a Canadian photographer.
Issue a letterFor grant and fellowship juries
Fund the paired-trip unit — planting and harvest, the same households, six months apart. Partial funding scales the route, never the method.
Deliverable: Published essays in which every figure traces to an open evidence layer — positions, retractions, forecast archives, all dated — plus the May 2027 return. Budgets are itemised in CAD, by leg, in section 08.
Fund the pairFor NGO and agency commissions
Commission field documentation around the November window: in-country 12–25 November with driver, fixer and translator already budgeted, three bases across the critical-tier districts.
Deliverable: A documentation set to the assignment brief with negotiated usage windows. Advocacy use is licensed; the journalism stays independent, and subjects are never shared between the two without consent.
Book the windowFollow this project. The dispatches track the forecast, the funding and the field from here to the May 2027 harvest — free, from this site.
Bryson Masse · Toronto · published work · 819 639 2571 · bryson.masse@gmail.com · Every figure generated from the project's data layer; forecast run 2026-08-25, built 2026-08-29.